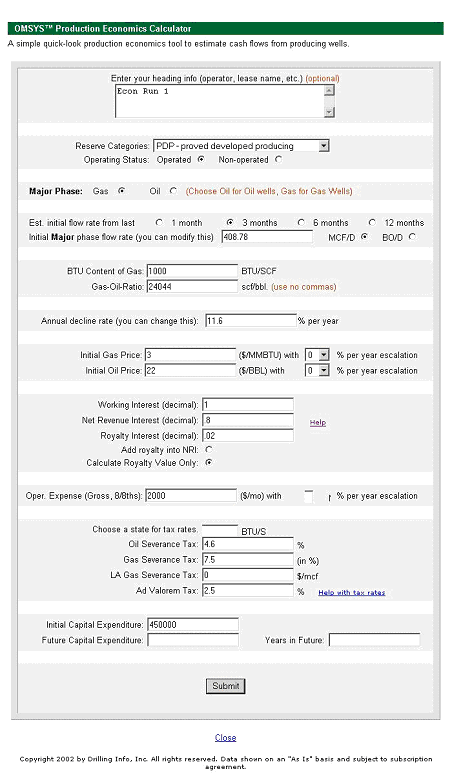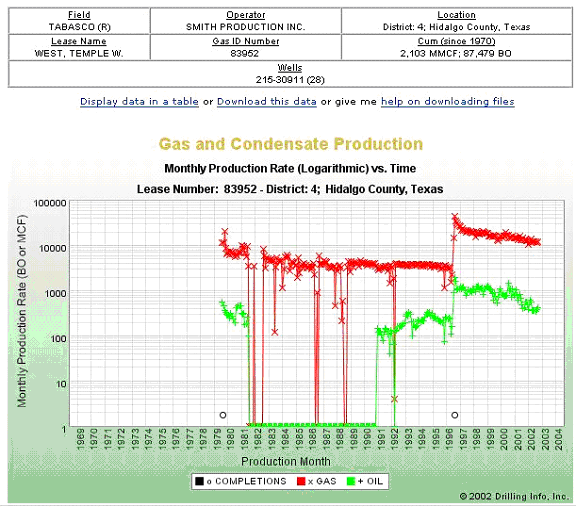
Run a quick and easy economic report of an oil lease or gas well using the Economic Analysis. The functionality exists to calculate the decline curve of a well below the standard Production Graph accessed by picking a production point on a map or by clicking gas or oil production links on the well or lease hub page.
(Also See Economic Analysis Help and Economic Analysis FAQ)

First, click BEGIN POINT SELECTION
Then, CLICK ON A FIRST POINT ON THE CHART ON THE LINEAR PORTION OF THE CURVE. (NOTE-Currently, we support exponential decline, which is commonly found in solution gas or gas cap expansion reservoirs, and is recognized by appearing as a sloping line on these graphs instead of a curve. Some reservoirs with early "curve" production will stabilize to exponential decline later. This method is not recommended for water drive reservoirs, which produce a similar rate until "catastrophic" failure.)
Click ON A SECOND POINT LATER IN TIME ALONG THE LINE.
The CALCULATED DECLINE RATE SHOULD THEN APPEAR ON YOUR Decline Curve CALCULATOR. See Decline Curve Analysis Help

You MAY OVERWRITE THESE RESULTS BY CLICKING "BEGIN POINT SELECTION" AGAIN. (NOTE- doing several to see the variance in decline rates between points is helpful. You want to match the line as closely as possible)
CLICK "START ECONOMIC ANALYSIS"; ANOTHER PAGE WILL POP UP.
IN EXAMPLE 1, WE WILL CALCULATE WORKING INTEREST.
The top of the page has an optional area for Title and Descriptor.
Then follows an optional category descriptor for production type, i.e. Operated or Non Operated, PDP, PUD, etc.
Major phase selector is usually automatically selected. However, make sure it is correct!
Estimated flow rate can be written in by you, or automatically calculated from the average of previous month, 3 months, 6 months, or 12 months production.
BTU Content is assumed at 1000. You may overwrite this. Gas/Oil ratio is automatically calculated from the historical average. You may overwrite this.
Annual Decline Rate is carried forward from the earlier step. However, you may overwrite this number.
You must fill in an initial gas and oil price assumption. It can be escalated at 0, 3, 5, 10, and 15%. In the case of associated gas in an oil lease, If the lease has no gas sales but does have production, use 0 as the gas price.
Enter in YOUR Working Interest, YOUR NRI for your Working Interest, and YOUR royalty or ORRI for the lease or well. If you have both WI and RI, you may calculate a combined economic analysis by clicking on “Add Royalty to NRI”. If you want to calculate your RI only, Click “Calculate Royalty Only”, you must still enter the NRI of the WI and Lease Operating Expenses to properly calculate the Economic Lifetime.
Input Operating Expenses. These can be escalated, as well.
Input tax rate if not correct.
Input capital cost and future cost (workover, pipeline, etc.) (Optional)
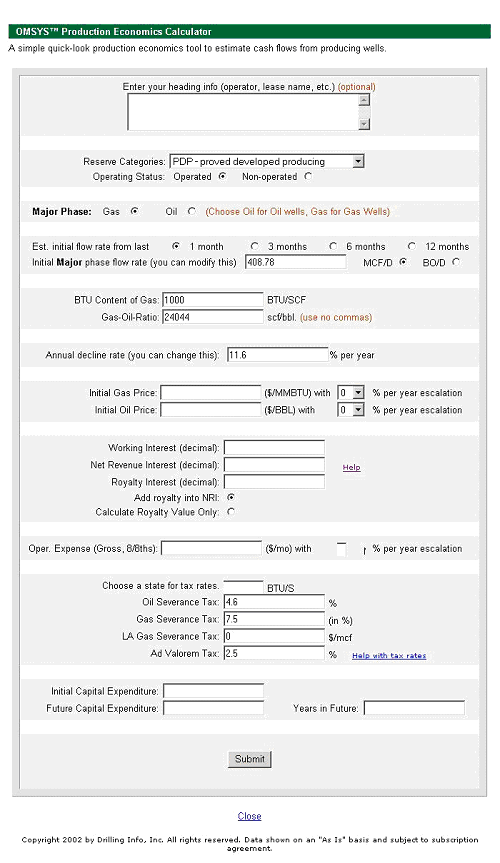
The page below is what is automatically generated:
After filling it out for WI, it looks like this:
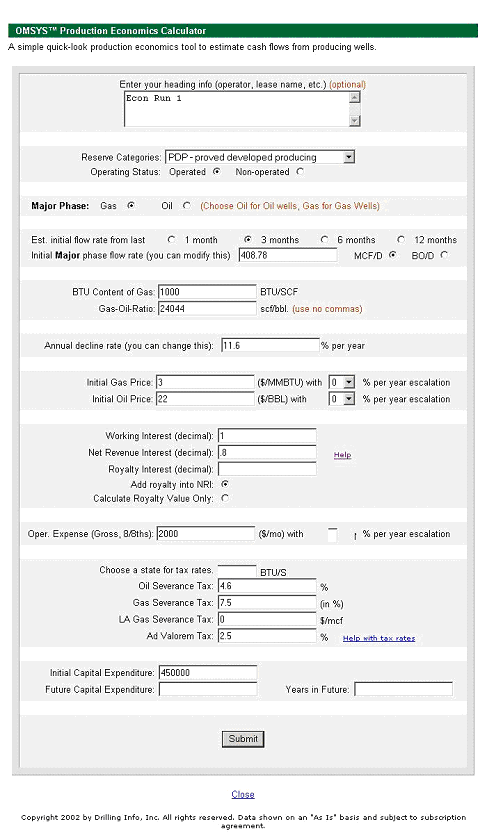
CLICK "SUBMIT" YOUR WELL OR LEASE ECONOMICS REPORT WILL POP-UP.
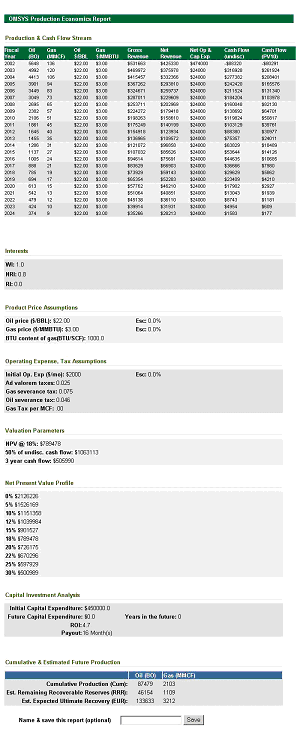
To Calculate a WI and RI Combined, the input chart would look like this… (RI filled in and “Add royalty interest to NRI” button underneath).
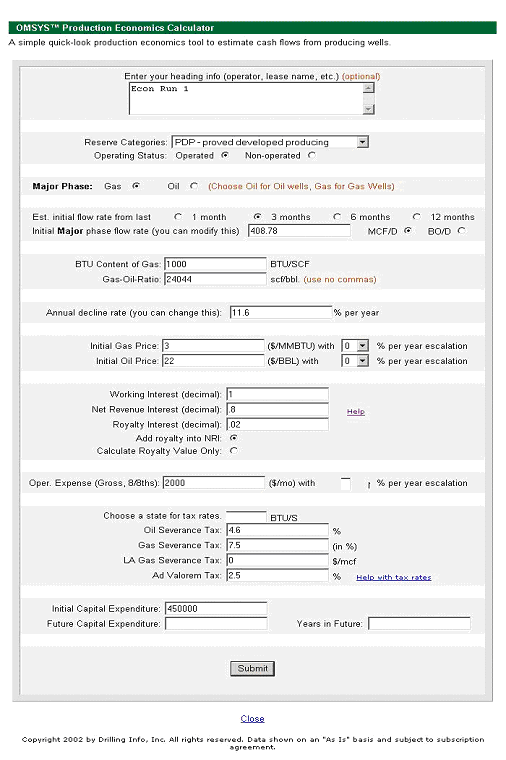
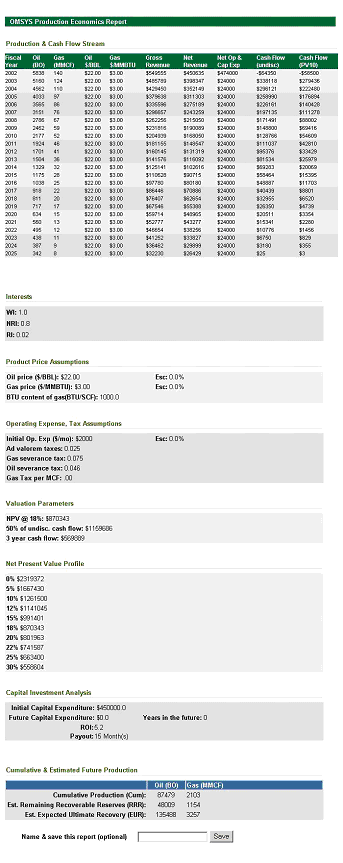
To calculate Royalty Only, make sure the WI and NRI is filled out, include your royalty interest, and make sure to click on “Calculate Royalty Value Only”.
