 in the map Navigator
To go from map view to table view, click the Table View button in the map Navigator
The Completion Table display is similar in form and function to the Permit Table display. If you choose to search for both oil and gas completions, you will be given a choice of which type of completion you want to display. Under search results, the layer being currently shown is in black, and the link to the other completion type is underlined and in blue.
An example of a search for both oil and gas completions in Goliad County, TX for the time period 12/1/2004 to 3/1/2005 is shown below. This search returned 9 oil completions and 59 gas completions. The example is for the gas completion part of the table.
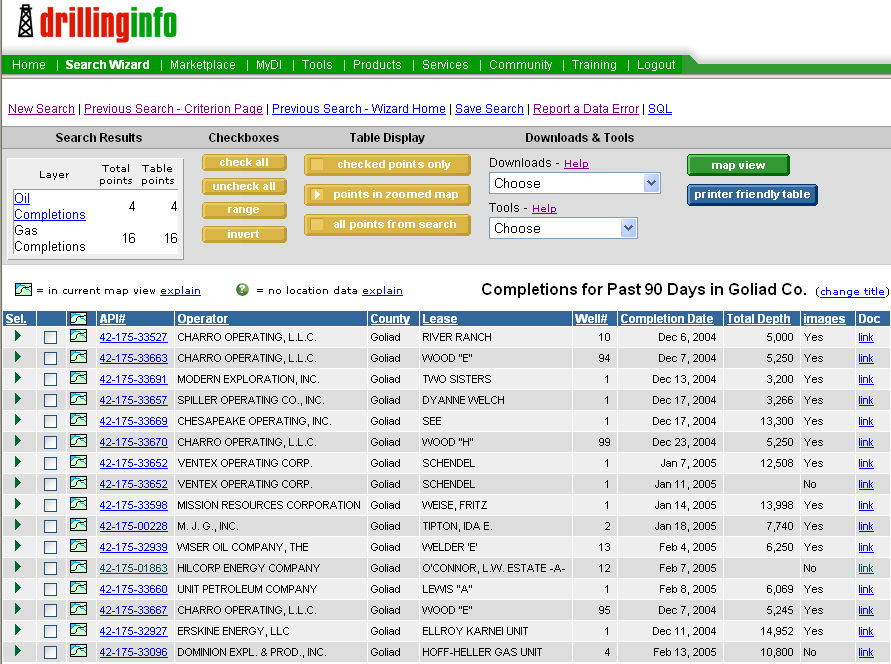
Tips:
Clicking on the linked API number will take you to the completion summary.
Note: The truncation notice associated with oil or gas completions means that there are more oil or gas completions than have been displayed. In order to see the full set, go back to the search wizard and choose search order depth on the bottom of the screen. Run the search, look at table view, and note the deepest completion. Then, rerun the search using that depth as the starting depth for your next search.
To convert from table view to map view, click on the Map View link. To print the table, click on the Printer Friendly Table link.
Under Checkboxes you can use the buttons to check all, uncheck all, select a range of results by selecting a beginning point and an ending point and then clicking range, and the invert button will reverse the selection.
The Table Display buttons will allow you to view only the checked points, only the points visible on the map or all points from the search.
The Downloads menu will allow you to chose several options for exporting the data, including:
Contour(.dcf) - Allows you to export the data directly into DI Surf
CSV This Table - Opens the Table View up in Microsoft Excel
CSV This Table (Zipped) - Exports the data in Table View to the Microsoft Excel on your system
Lat/Longs for Checked Points - Downloads the lat/longs for the selected wells into two new columns in Table View
GeoGraphix ASCII3 - Formats DI data into a file for import into GeoGraphix
Petra - Formats DI data into a file for import into Petra
PDF - Creates a PDF image of the Table View
The Tools menu contains:
MyInfo Quick Tag - Allows you to quickly tag elements for My Info
Convert Coordinates - Allows you to convert already downloaded lat/longs to a different projection (For example, from NAD 27 to State Planes or NAD 83)
See Table Help for more information on displaying and sorting results.